Getting Started > Windows
Intro
This getting started guide will walk you through:
Installing Docker and Kubernetes on your local machine.
Running a pre-configured Kubernetes development/operations environment which standardizes a team on a common toolset.
Introducing the “framework-deploy” pattern which enables teams to easily manage and operate multiple clusters and configurations.
Deploying a few basic services in Kubernetes such as logging, monitoring, and dashboards.
Accessing the newly deployed basic service dashboards and introducing introduce their usage.
Requirements
- Windows 10 Pro or Windows 10 Enterprise is required.
- You must execute all PowerShell commands as an administrative user.
- 8 GB RAM
- 2 CPU cores
- BIOS Settings with Hardware Virtualization Enabled (VTx and VT-d)
Step 1: Chocolatey
Open a Powershell terminal as Administrator.
Windows Search->Windows PowerShell-> right clickRun as Administrator
Install Chocolatey.
# Windows Powershell as Administrator
Set-ExecutionPolicy Bypass -Scope Process -Force
iex ((New-Object System.Net.WebClient).DownloadString('https://chocolatey.org/install.ps1'))
Step 2: Docker
Install Docker for Windows.
# Windows Powershell as Administrator
choco install -y docker-for-windows
- If at any point during these instructions you receive an undocumented prompt of Docker requesting elevated permissions, please select the Affirmative answer.
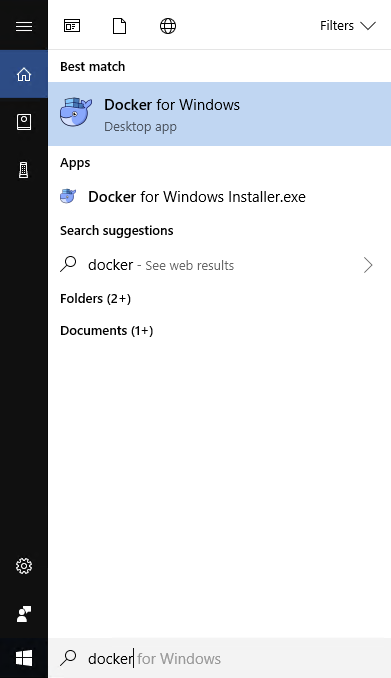
Start Docker.
- Windows Search ->
Docker For Windows-> (Enter)
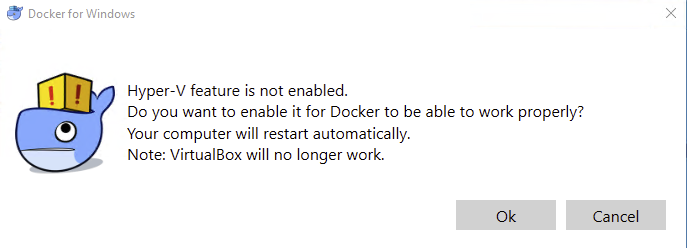
- If you receive a prompt to enable Hyper-V, then enable it by clicking
Ok. This will restart your computer, at which point you will have to start Docker for Windows again by following the prior step.
The Docker icon should now be displayed in the taskbar tray.
Open the Docker menu by right clicking the Docker icon and selecting
Settings.
![]()
- On the
Generaltab:- Toggle on
Start Docker when you log in - Toggle on
Automatically check for updates
- Toggle on
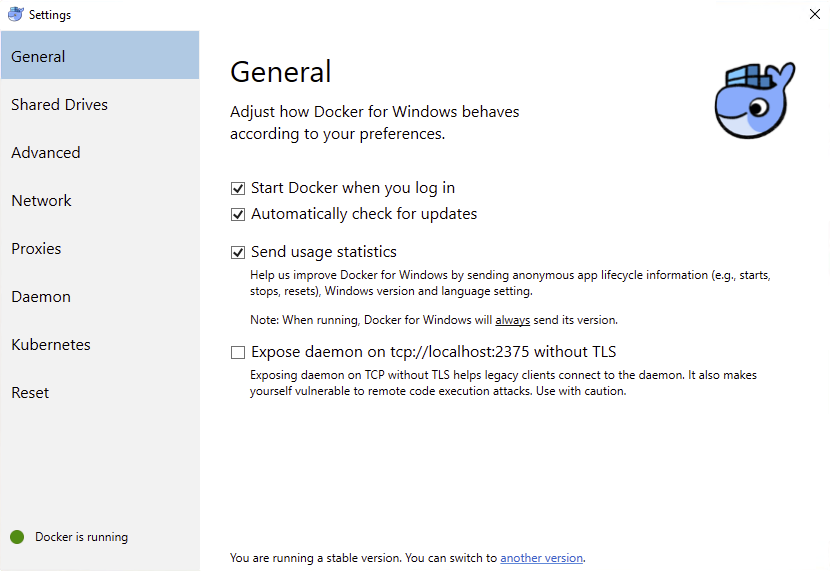
- After a minute or two, you should see
Docker is runningwith a green circle.
Step 3: Kubernetes
Ensure Docker is running by completing Step 2: Docker above.
Open the Docker menu by right clicking the Docker icon in the taskbar tray and selecting
Settings.
![]()
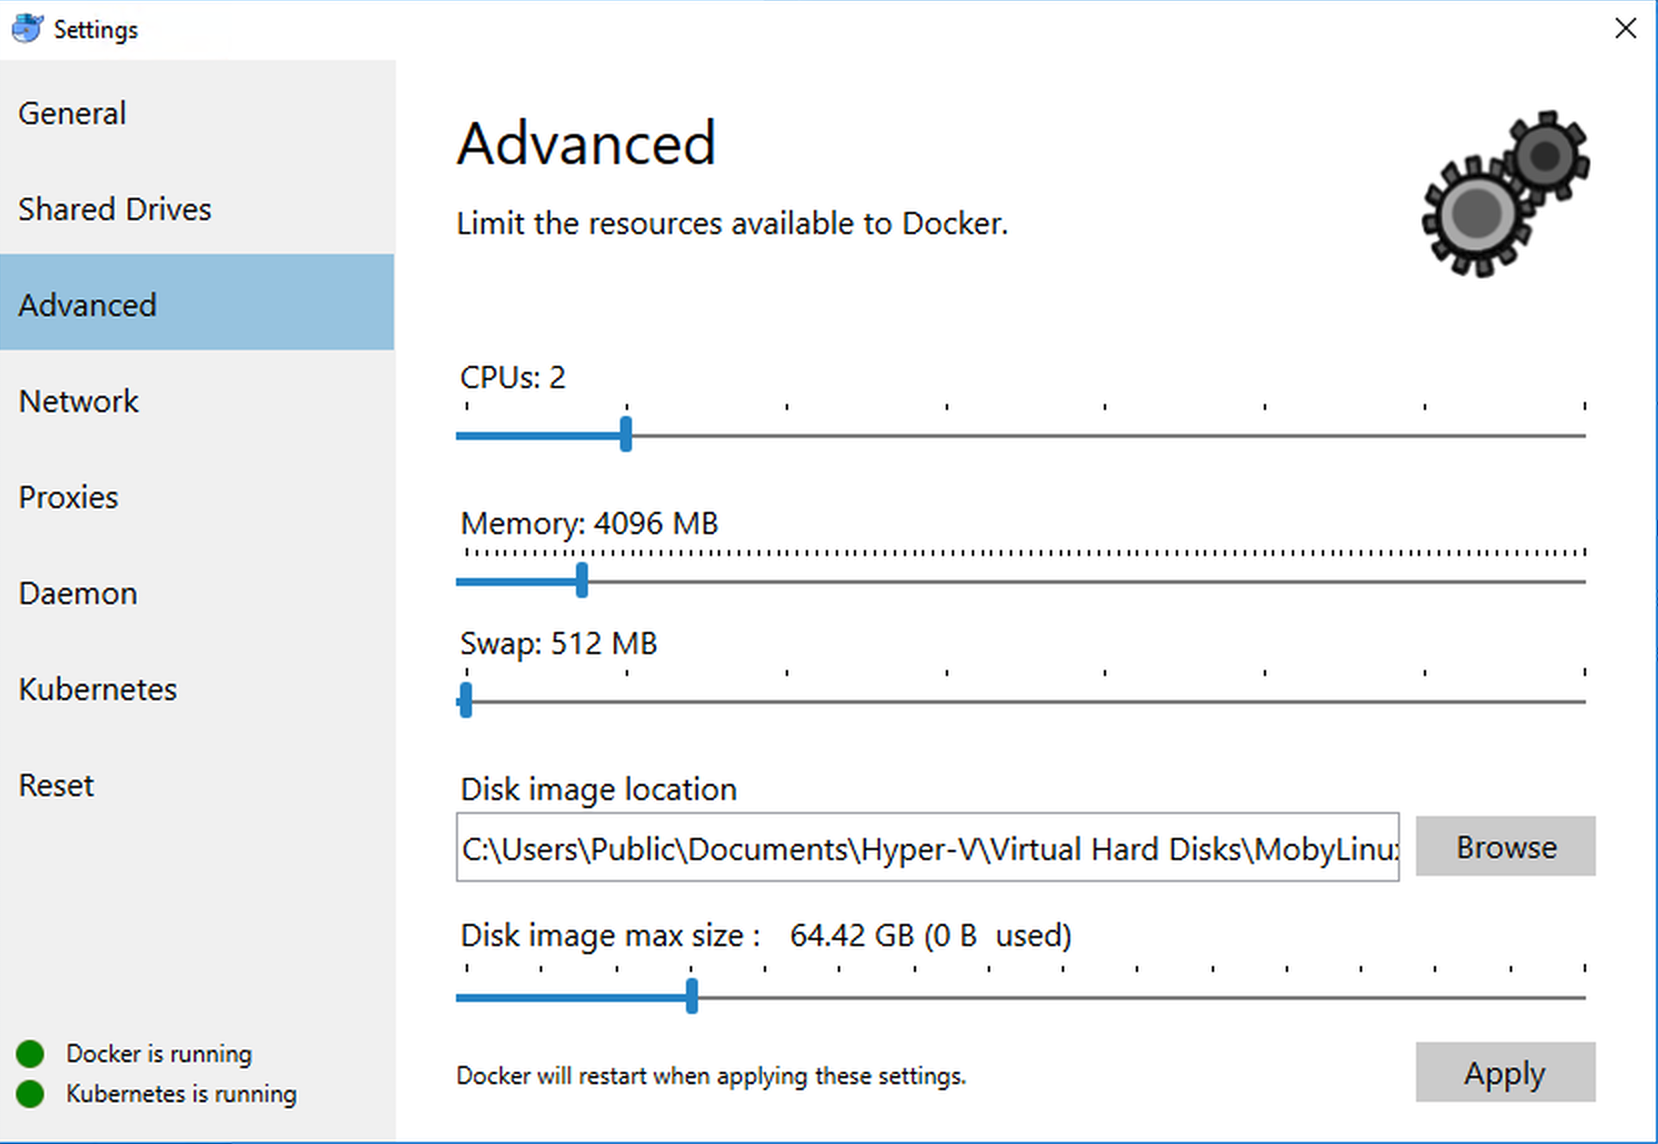
- On the
Advancedtab:- Set CPUs: 2
- Set Memory: 4.0GiB
- Set Swap: 512MiB
- Click
Apply
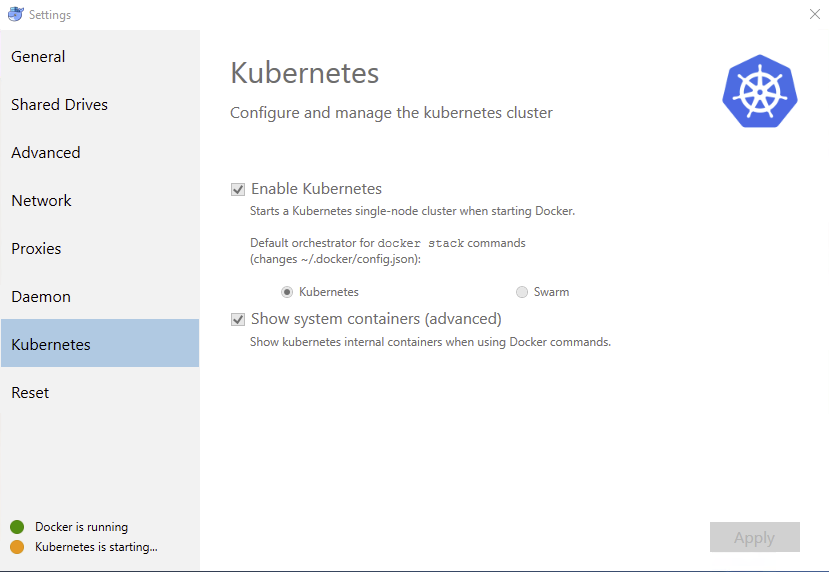
- On the
Kubernetestab:- Toggle on
Enable Kubernetes. - Click the
Kubernetesradio button underDefault orchestrator for "docker stack" commands. - Toggle on
Show system containers (advanced). - Click
Apply.
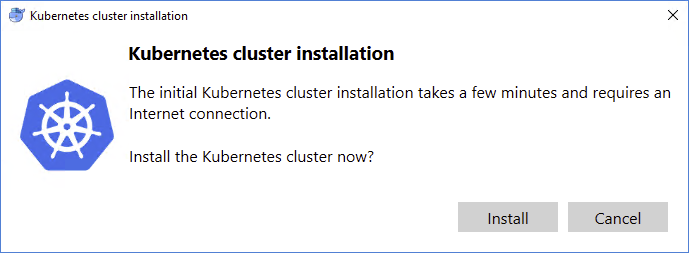
- Toggle on
- When prompted with “Kubernetes cluster installation”, accept by clicking
Install
- Wait for the “Installation Complete!” dialog, and click
Close
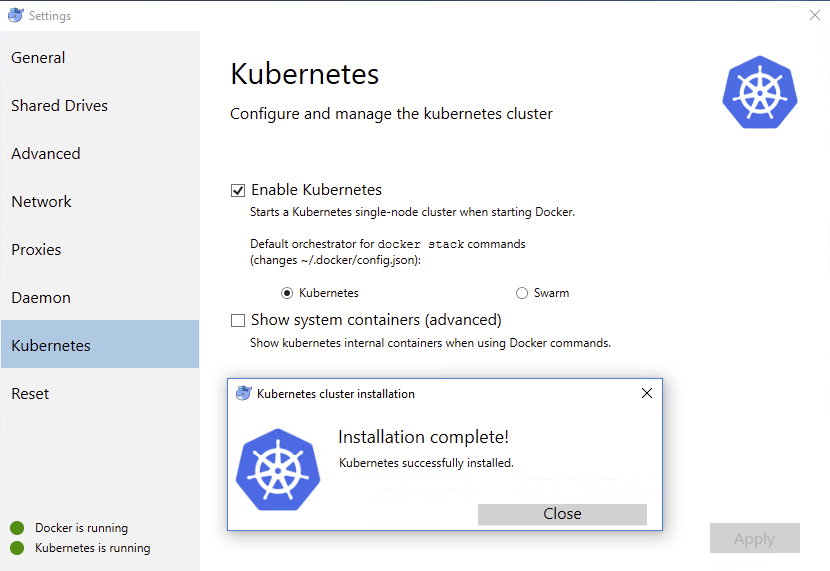
- Once Kubernetes is ready, you will see
Kubernetes is running.
We’ll explore Kubernetes more later in this guide from inside of a Kubernetes Development Kit (KDK) container.
Step 4: Keybase
Keybase makes sharing secrets with your team much easier. A Keybase user may be added to one
or more Keybase Teams, at which point the team’s secret files are accessible
under your local filesystem at k:. Scripts and automation may then locate secrets
within the Keybase filesystem at common paths.
Later in this guide (upon kdk init), the kdk command will detect if keybase is present and then prompt the user to
mount the host’s Keybase filesytem to the KDK container at /keybase.
Register a userid at keybase.io displaying your full name. Be a good Keybase citizen and ensure you are publish at least one verification.
Ask your team lead to add you to relevant Keybase teams. This will allow you to access team files at
k:/team/<team-name>.
Install Keybase.
# Windows Powershell as Administrator
choco install -y keybase
Open Keybase.
Windows Search->keybase- Login using your keybase.io credentials and authorize the client.
Enable Keybase Files.
Settings->Files->Enable Keybase in Explorer
Verify that KeybaseFS is mounted to your system.
# Windows Powershell
dir k:
## private  public  team
Step 5: KDK
The KDK CLI creates a Docker container with many tools already installed and ready for you to develop with Kubernetes.
Install Prerequisites
# Windows Powershell as Administrator
choco install openssh
Install the Kubernetes Development Kit (KDK).
# Windows Powershell - NOT AS ADMINISTRATOR
Set-ExecutionPolicy Bypass -Scope Process -Force
iex ((New-Object System.Net.WebClient).DownloadString('https://raw.githubusercontent.com/cisco-sso/kdk/master/files/install.ps1'))
Print KDK usage information.
kdk
Configure KDK.
When running kdk init, please accept when prompted
Please respond affirmatively when prompted for:
- Keybase directory mounting
- Enabling the SOCKS proxy at default port 8000
kdk init
Synchronize KDK container with Docker for Desktop KUBECONFIG.
The prior install of Kubernetes on the local host machine create a KUBECONFIG file at ~/.kube/config which contains
the auth credenials for accessing the local kubernetes cluster. Since we want to do all operations from within the KDK,
we must copy the host’s default KUBECONFIG into the KDK, and modify the docker-for-desktop configuration to work from
within the kdk.
kdk kubesync
Run the KDK container and log into it.
kdk ssh
Step 6: Framework Deploy
Framework-deploy is a git repo which implments the KDF deployment pattern. The boilerplate structure in framework-deploy is made to fit perfectly with the tools available in the KDK container. One may fork this repo as a basis for implementing the framework-deploy pattern for private kubernetes clusters.
Clone the framework-deploy repo using git.
# Within your KDK container via `kdk ssh`
#### Run this command if you have configured your GitHub account for public key SSH.
git clone git@github.com:cisco-sso/framework-deploy.git

#### (OR) Run this command if you have not configured GitHub for public key SSH.
git clone https://github.com/cisco-sso/framework-deploy.git
Change to the framework-deploy directory.
# Within your KDK container via `kdk ssh`
cd framework-deploy/
## direnv: error .envrc is blocked. Run `direnv allow` to approve its content.
direnv allow
Take a look around framework-deploy.
# Important Files
.
├── apps
├── bin
├── clusters
└── .envrc
clusters
The clusters directory contains a directory for each Kubernetes cluster managed with framework-deploy. By entering the
clusters/docker-for-desktop.example.org directory, the system automatically configures all tools to operate on the
docker-for-desktop.example.org Kubernetes cluster that was spun up earlier in this tutorial.
In the framework-deploy pattern, the cluster directory, kubernetes context, and KUBECONFIG filename are all set to match
the cluster’s external FQDN (e.g. myorg1-dev.example.org). This naming convention enables framework-deploy automation
to simplify interactive cluster usage.
apps
The apps directory contains template files for the mh command. The values from the
mh/main.yaml inside of a cluster directory are applied to an “app” template file, producing custom configuration
overrides for a particular Helm chart.
bin
The bin directory contains scripts that simplify specific operations. For example, bin/get-password-grafana.sh is a
helper script that retrieves the auto-generated admin password for grafana from the kubernetes
secret as installed by framework-deploy.
.envrc
Upon entering a directory that contains an .envrc file, the direnv tool installed within the KDK container will
automatically source the .envrc file if it is present.
If direnv encounters an .envrc file it has not previously processed, or one that has changed since last seen,
direnv will prompt you to approve the processing of its content. If you approve, run direnv allow.
Change to the clusters/docker-for-desktop.example.org
# Within your KDK container via `kdk ssh`
cd clusters/docker-for-desktop.example.org
## direnv: error .envrc is blocked. Run `direnv allow` to approve its content.
direnv allow
Take a look around the clusters/docker-for-desktop.example.org directory.
# Important Files
.
├── .envrc
├── mh
│   └── main.yaml
└── vars.yaml
mh/main.yaml
Inside of a cluster directory, the values from the mh/main.yaml file are applied to an “app” template file, producing
custom configuration overrides for a particular Helm chart. The mh tool, which ships
with the KDK container image, applies the template transformations to produce helm chart overrides, piping the result to
helm which then produces resource definitions which are loaded into kubernetes. The mh tool is a variation of helm
umbrella charts, explained
here
vars.yaml
In the framework-deploy pattern, upon entering this directory, the direnv tool sources the .envrc file which then
reads configuration settings out of vars.yaml, ultimately setting enviroment variables to configure tools.
Interact with Kubernetes using kubectl.
# Within your KDK container via `kdk ssh`

kubectl config get-contexts
## CURRENT  NAME                            CLUSTER                         AUTHINFO                        NAMESPACE
## *        docker-for-desktop.example.org  docker-for-desktop.example.org  docker-for-desktop.example.org

kubectl config current-context
## docker-for-desktop.example.org

kubectl version
## Client Version: version.Info{Major:"1", Minor:"11", GitVersion:"v1.11.1", GitCommit:"b1b29978270dc22fecc592ac55d903350454310a", GitTreeState:"clean", BuildDate:"2018-07-18T11:36:43Z", GoVersion:"go1.10.3", Compiler:"gc", Platform:"darwin/amd64"}
## Server Version: version.Info{Major:"1", Minor:"10", GitVersion:"v1.10.3", GitCommit:"2bba0127d85d5a46ab4b778548be28623b32d0b0", GitTreeState:"clean", BuildDate:"2018-05-21T09:05:37Z", GoVersion:"go1.9.3", Compiler:"gc", Platform:"linux/amd64"}

kubectl get nodes
## NAME                 STATUS    ROLES     AGE       VERSION
## docker-for-desktop   Ready     master     1h       v1.10.3

kubectl get statefulsets --all-namespaces
## No resources found.

kubectl get deployments --all-namespaces
## NAMESPACE     NAME          DESIRED   CURRENT   UP-TO-DATE   AVAILABLE   AGE
## docker        compose       1         1         1            1           21h
## docker        compose-api   1         1         1            1           21h
## kube-system   kube-dns      1         1         1            1           21h

kubectl get pod --all-namespaces
## NAMESPACE     NAME                                         READY     STATUS    RESTARTS   AGE
## docker        compose-7447646cf5-gbcrx                     1/1       Running   0          1h
## docker        compose-api-6fbc44c575-gd92f                 1/1       Running   0          1h
## kube-system   etcd-docker-for-desktop                      1/1       Running   1          1h
## kube-system   kube-apiserver-docker-for-desktop            1/1       Running   1          1h
## kube-system   kube-controller-manager-docker-for-desktop   1/1       Running   1          1h
## kube-system   kube-dns-86f4d74b45-snz5s                    3/3       Running   0          1h
## kube-system   kube-proxy-dmqvq                             1/1       Running   0          1h
## kube-system   kube-scheduler-docker-for-desktop            1/1       Running   1          1h
Initialize Helm Tiller into your local Kubernetes cluster.
# Within your KDK container via `kdk ssh`

helm version
## Client: &version.Version{SemVer:"v2.10.0", GitCommit:"9ad53aac42165a5fadc6c87be0dea6b115f93090", GitTreeState:"clean"}
## Error: could not find tiller

helm init --wait
## $HELM_HOME has been configured at /home/<you>/.helm.
##
## Tiller (the Helm server-side component) has been installed into your Kubernetes Cluster.
##
## Please note: by default, Tiller is deployed with an insecure 'allow unauthenticated users' policy.
## To prevent this, run `helm init` with the --tiller-tls-verify flag.
## For more information on securing your installation see: https://docs.helm.sh/using_helm/#securing-your-helm-installation
## Happy Helming!

helm version
## Client: &version.Version{SemVer:"v2.10.0", GitCommit:"9ad53aac42165a5fadc6c87be0dea6b115f93090", GitTreeState:"clean"}
## Server: &version.Version{SemVer:"v2.10.0", GitCommit:"9ad53aac42165a5fadc6c87be0dea6b115f93090", GitTreeState:"clean"}
Simulate the deployment of KDF apps using mh.
# Within your KDK container via `kdk ssh`
mh simulate --printRendered
## ...
Apply the deployment of KDF apps using mh.
# Within your KDK container via `kdk ssh`
mh apply
## ...
Inspect the resulting Helm releases.
# Within your KDK container via `kdk ssh`

helm ls
## NAME                   REVISION UPDATED                  STATUS   CHART                        APP VERSION NAMESPACE
## chaoskube              1        Thu Sep 27 15:37:53 2018 DEPLOYED chaoskube-0.8.0              0.8.0       default
## elasticsearch          1        Thu Sep 27 15:37:40 2018 DEPLOYED elasticsearch-1.4.0          6.3.1       default
## elasticsearch-exporter 1        Thu Sep 27 15:37:42 2018 DEPLOYED elasticsearch-exporter-0.2.0 1.0.2       default
## filebeat               1        Thu Sep 27 15:37:47 2018 DEPLOYED filebeat-0.6.0               6.3.1       default
## grafana                1        Thu Sep 27 15:37:51 2018 DEPLOYED grafana-1.13.1               5.1.3       default
## kibana                 1        Thu Sep 27 15:37:45 2018 DEPLOYED kibana-0.8.0                 6.3.1       default
## nginx-ingress-external 1        Thu Sep 27 15:37:43 2018 DEPLOYED nginx-ingress-0.23.0         0.15.0      default
## prometheus             1        Thu Sep 27 15:37:48 2018 DEPLOYED prometheus-7.0.0             2.3.2       default
Use the watch command to monitor the status.
(Use CTRL + c to exit the watch command loop.)
# Within your KDK container via `kdk ssh`

watch -n1 'kubectl get pod'
## Every 1.0s: kubectl get pod
##
## NAME                                                            READY     STATUS              RESTARTS   AGE
## chaoskube-chaoskube-7f5874cc98-nvksz                            0/1       ContainerCreating   0          9s
## elasticsearch-client-7cdc657767-p9kzq                           0/1       PodInitializing     0          22s
## elasticsearch-data-0                                            0/1       Init:1/2            0          22s
## elasticsearch-exporter-elasticsearch-exporter-659975bf4-b75sf   1/1       Running             0          20s
## elasticsearch-master-0                                          0/1       Init:0/2            0          22s
## filebeat-dvgd8                                                  0/1       ContainerCreating   0          15s
## grafana-599bd6c66-fqf98                                         0/1       Init:0/1            0          11s
## kibana-5f66c65c47-6nttz                                         0/1       ContainerCreating   0          17s
## nginx-ingress-external-controller-dd7775d7f-clflh               0/1       ContainerCreating   0          19s
## nginx-ingress-external-default-backend-744cd584cf-drxx9         0/1       ContainerCreating   0          19s
## prometheus-alertmanager-6bfdc4b7f4-4wtxl                        0/2       ContainerCreating   0          13s
## prometheus-kube-state-metrics-6584885ccf-l7lnz                  0/1       ContainerCreating   0          13s
## prometheus-node-exporter-zzz5b                                  0/1       ContainerCreating   0          13s
## prometheus-pushgateway-d5fdc4f5b-wjzdt                          0/1       ContainerCreating   0          13s
## prometheus-server-5c969bc49c-jm9fl                              0/2       PodInitializing     0          13s
You should soon see that all pods are running and ready.
## Every 1.0s: kubectl get pod
##
## NAME                                                            READY     STATUS    RESTARTS   AGE
## chaoskube-chaoskube-7f5874cc98-nvksz                            1/1       Running   0          21m
## elasticsearch-client-7cdc657767-p9kzq                           1/1       Running   0          21m
## elasticsearch-data-0                                            1/1       Running   0          21m
## elasticsearch-exporter-elasticsearch-exporter-659975bf4-b75sf   1/1       Running   0          21m
## elasticsearch-master-0                                          1/1       Running   0          21m
## elasticsearch-master-1                                          1/1       Running   0          18m
## filebeat-dvgd8                                                  1/1       Running   0          21m
## grafana-599bd6c66-fqf98                                         1/1       Running   0          21m
## kibana-5f66c65c47-6nttz                                         1/1       Running   0          21m
## nginx-ingress-external-controller-dd7775d7f-clflh               1/1       Running   0          21m
## nginx-ingress-external-default-backend-744cd584cf-drxx9         1/1       Running   0          21m
## prometheus-alertmanager-6bfdc4b7f4-4wtxl                        2/2       Running   0          21m
## prometheus-kube-state-metrics-6584885ccf-l7lnz                  1/1       Running   0          21m
## prometheus-node-exporter-zzz5b                                  1/1       Running   0          21m
## prometheus-pushgateway-d5fdc4f5b-wjzdt                          1/1       Running   0          21m
## prometheus-server-5c969bc49c-jm9fl                              2/2       Running   0          21m
Get a list of Kubernetes Ingress resources.
# Within your KDK container via `kdk ssh`

kubectl get ingress
## NAME                      HOSTS                                         ADDRESS     PORTS     AGE
## grafana                   grafana.docker-for-desktop.example.org        localhost   80        21m
## kibana                    kibana.docker-for-desktop.example.org         localhost   80        21m
## prometheus-alertmanager   alertmanager.docker-for-desktop.example.org   localhost   80        21m
## prometheus-pushgateway    pushgateway.docker-for-desktop.example.org    localhost   80        21m
## prometheus-server         prometheus.docker-for-desktop.example.org     localhost   80        21m
HTTP GET an API behind a Kubernetes Ingress resource.
This curl command performs an HTTP GET against the Prometheus API which is exposed by the nginx-ingess. Note how the host header is used for ingress routing.
# Within your KDK container via `kdk ssh`

curl -fsSL \
  --header 'Host: prometheus.docker-for-desktop.example.org' \
  http://host.docker.internal/api/v1/label/__name__/values \
  | jq '.status'
## "success"
It is also possible to visit ingress endpoints in the broswer on your host machine. However, you’ll need to include
hosts file lines to ensure the ingress host names resolve properly to
127.0.0.1. We plan to add documentation to simplify and clarify how this is done.
Step 7: Explore Kubernetes
In this section, explore your newly provisioned Kubernetes cluster along with all of the basic services you have deployed via the framework-deploy code repository. You will connect to the admin panels of the services you have deployed. Connecting to these admin panels requires a web browser which is configured to use the KDK as a SOCKS proxy. The KDK will proxy all web requests to the internal ingress, so that one may access the dashboards using the configured cluster DNS name (*.docker-for-desktop.example.org).
Open up a SOCKS connection by connecting to your KDK
# Host machine shell
kdk ssh
Install Firefox
We prefer Firefox because it allows one to manage network proxy configurations independently of the host operating system.
Download Firefox here or install it through a prior-installed package manager as prior steps have demonstrated.
Configure your web browser to connect via the KDK SOCKS proxy
It may be beneficial to start Firefox with the profile manager so that you can keep these settings separate from the
default instance. Start the profile manager by adding the -P option on the command line. See this
link for instructions.
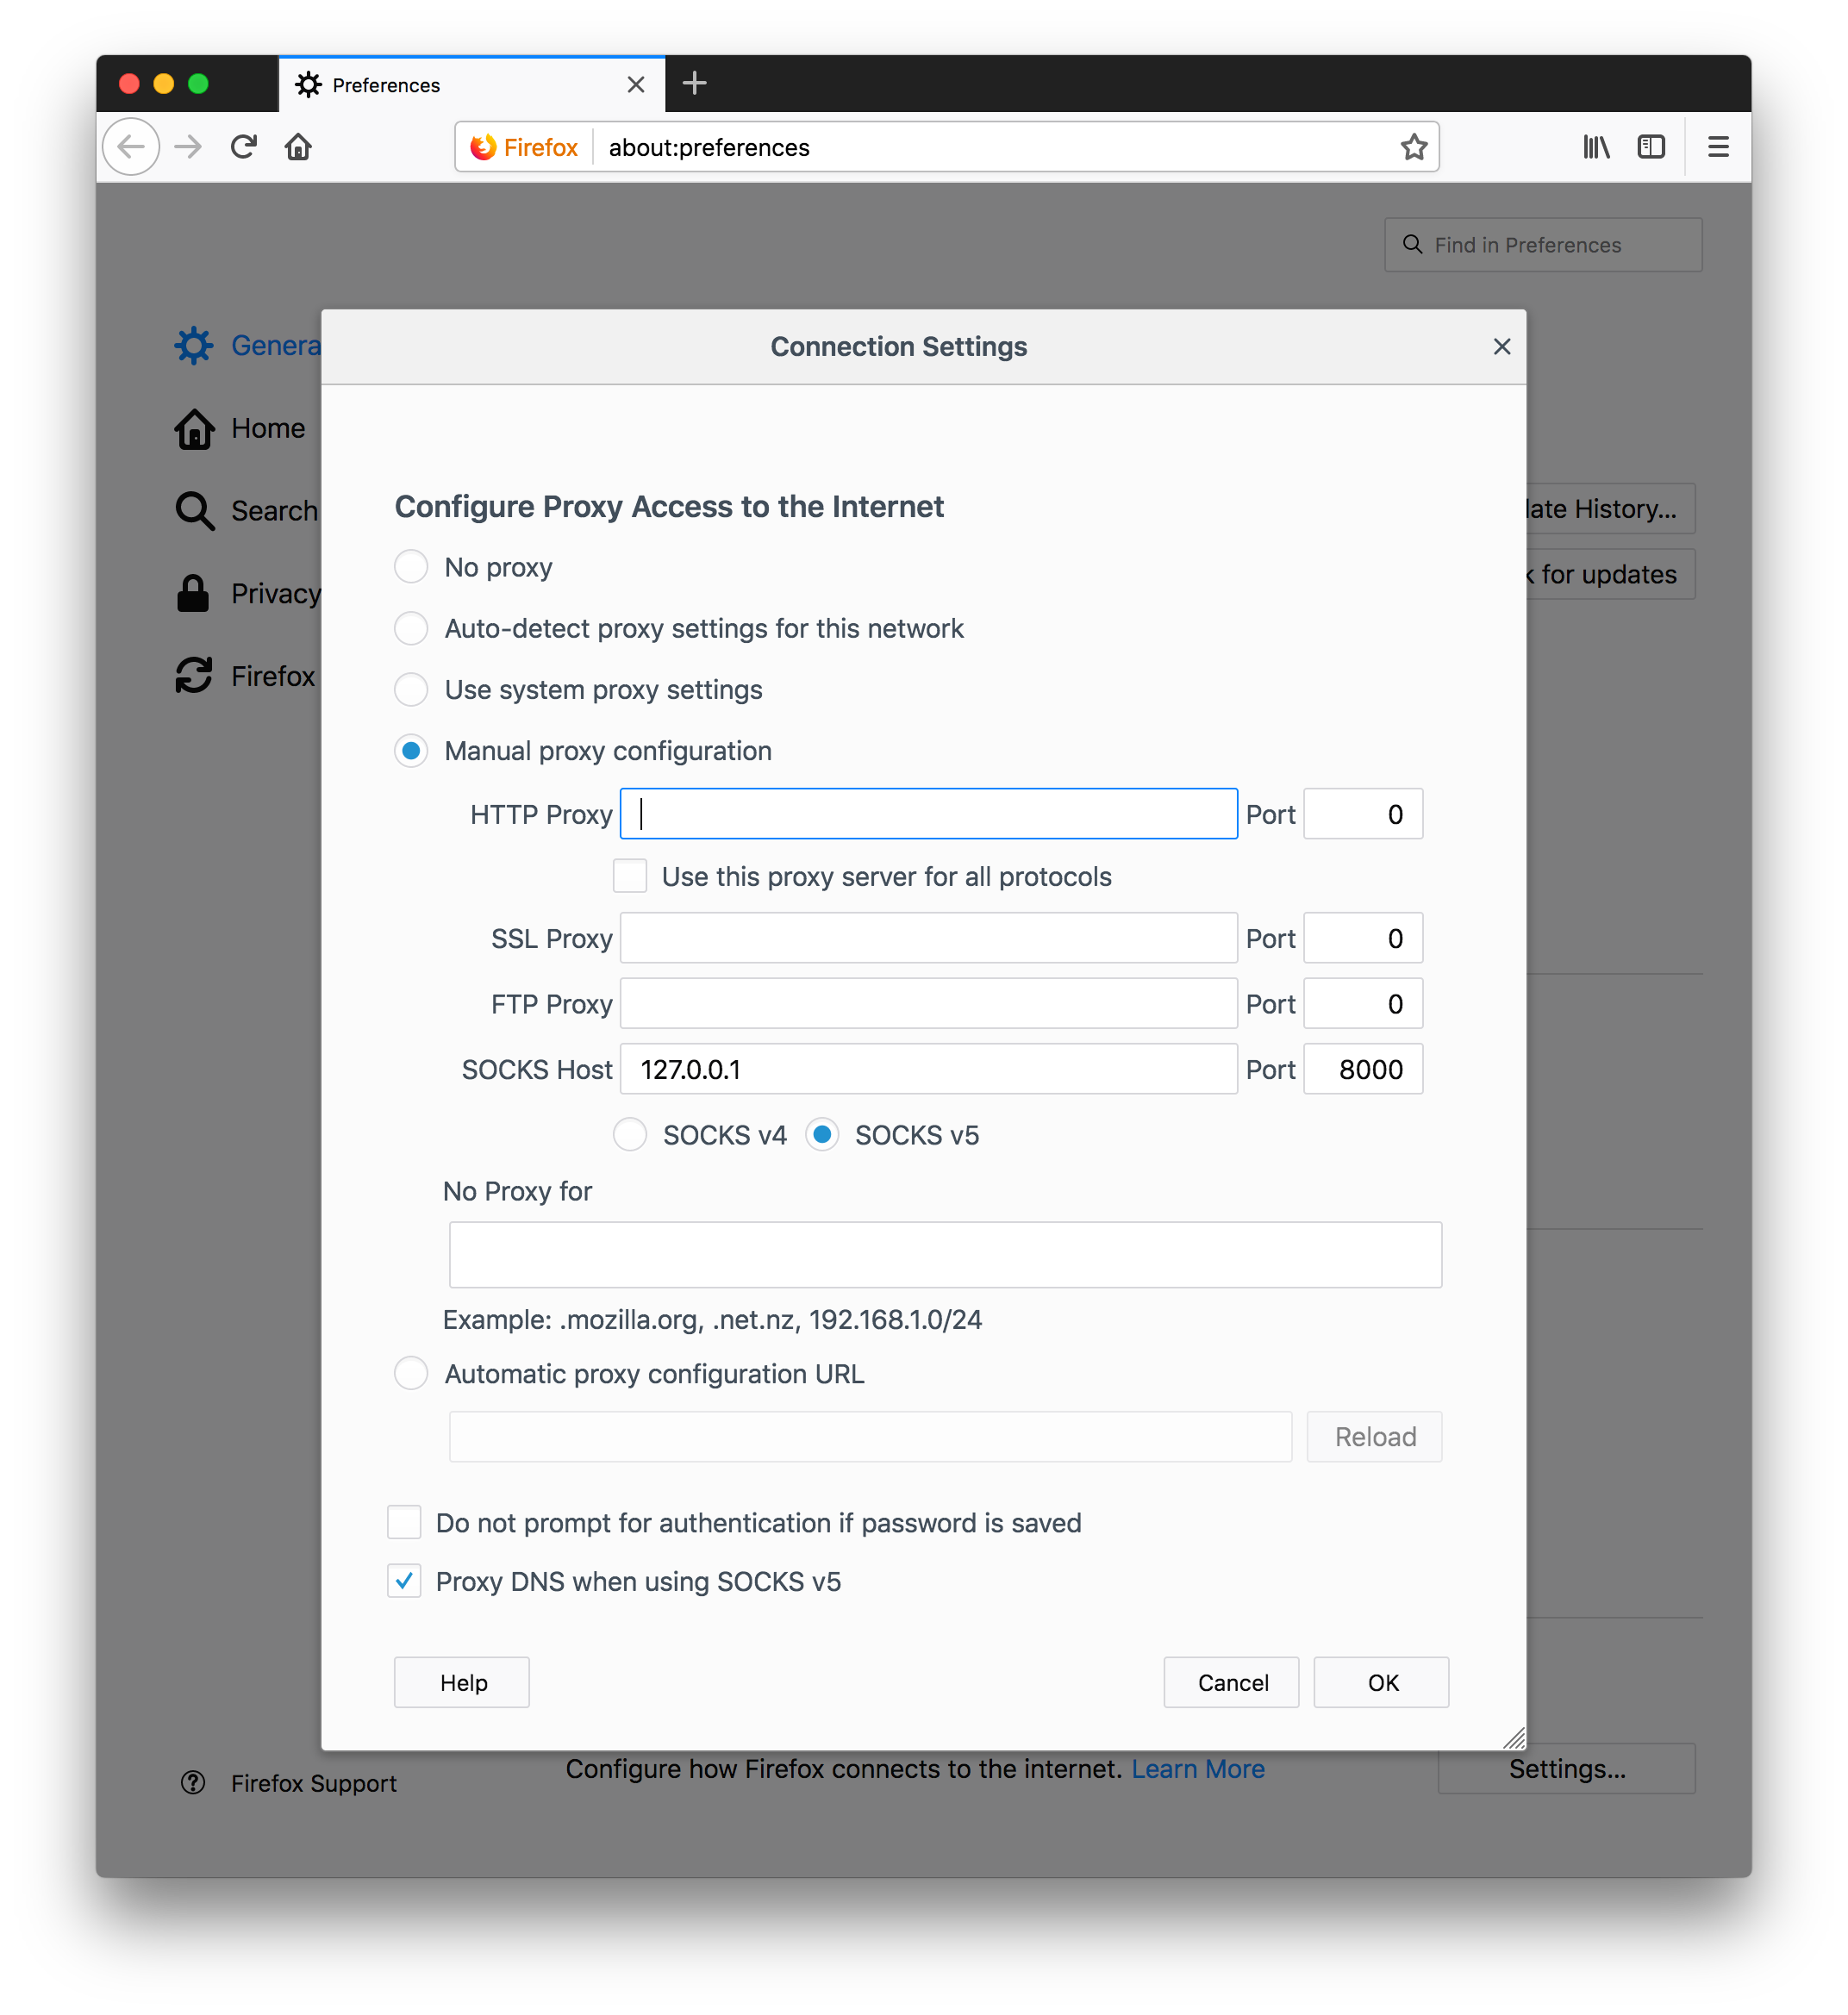
Firefox -> General -> Network Proxy -> Click Settings
- In the Settings window:
- Toggle on
Manual proxy configuration - Enter SOCKS Host value “127.0.0.1”
- Enter SOCKS Port value “8000”
- Toggle on
SOCKS v5 - Toggle on
Proxy DNS when using SOCKS v5 - Click
OK
- Toggle on
Once Firefox has been started, you may access all of the admin panels
The following links will work if you have successfully setup the KDK SOCKS proxy with Firefox.
Kibana
Grafana
Prometheus
Warning
The rest of this section assumes that you have successfully properly setup your SOCKS proxy and web browser, and can reach the links mentioned prior.
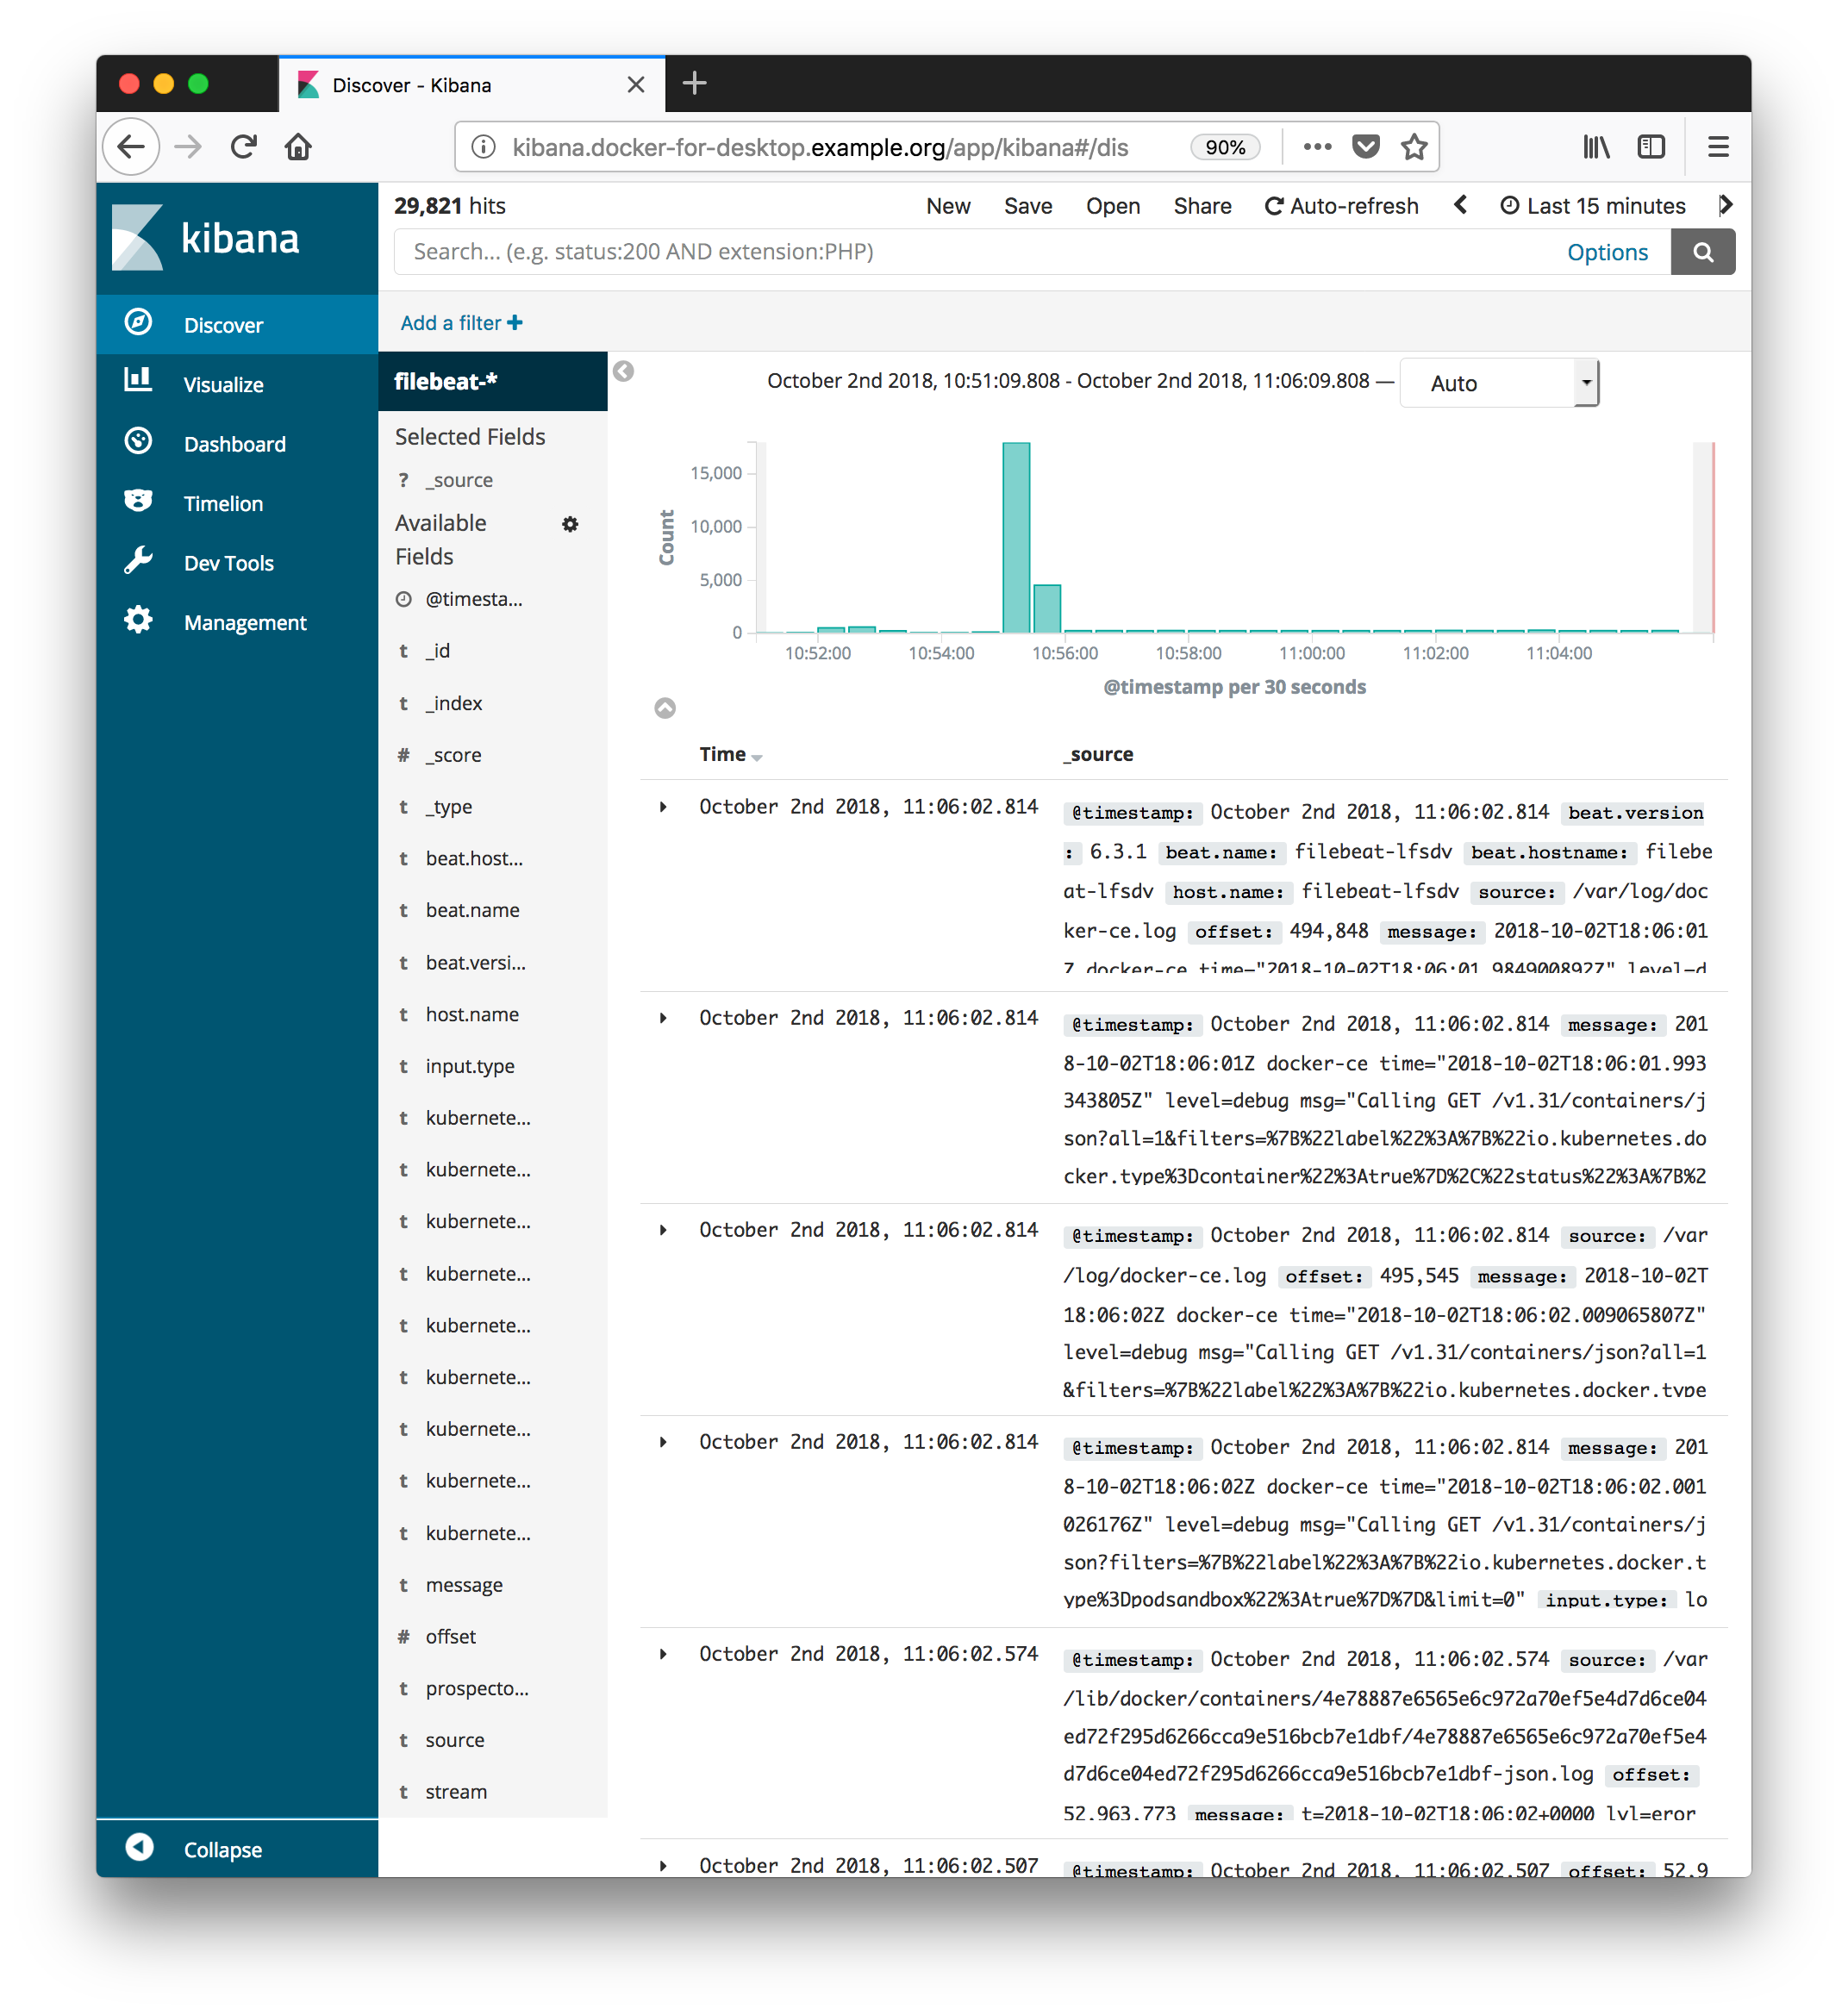
Explore Kibana
Kibana is a view into Elasticsearch, where all logs in the Kubernetes system are forwarded.
- Go to the Kibana admin panel:
- Configure Kibana so it will show you logs:
- Click the
Managementtab - Under Step 1 of 2: Define index pattern
- Set Index pattern:
filebeat-* - A message with “Success! Your index pattern matches” should appear
- Click
Next Step - Under Step 2 of 2: Configure Settings
- Set the Time Filter field name:
@timestamp - Click
Create index pattern
- Click the
- View system logs:
- Click the
Discovertab - Now you should see system logs.
- For more information on Kibana searches, see the official documentation
- Click the
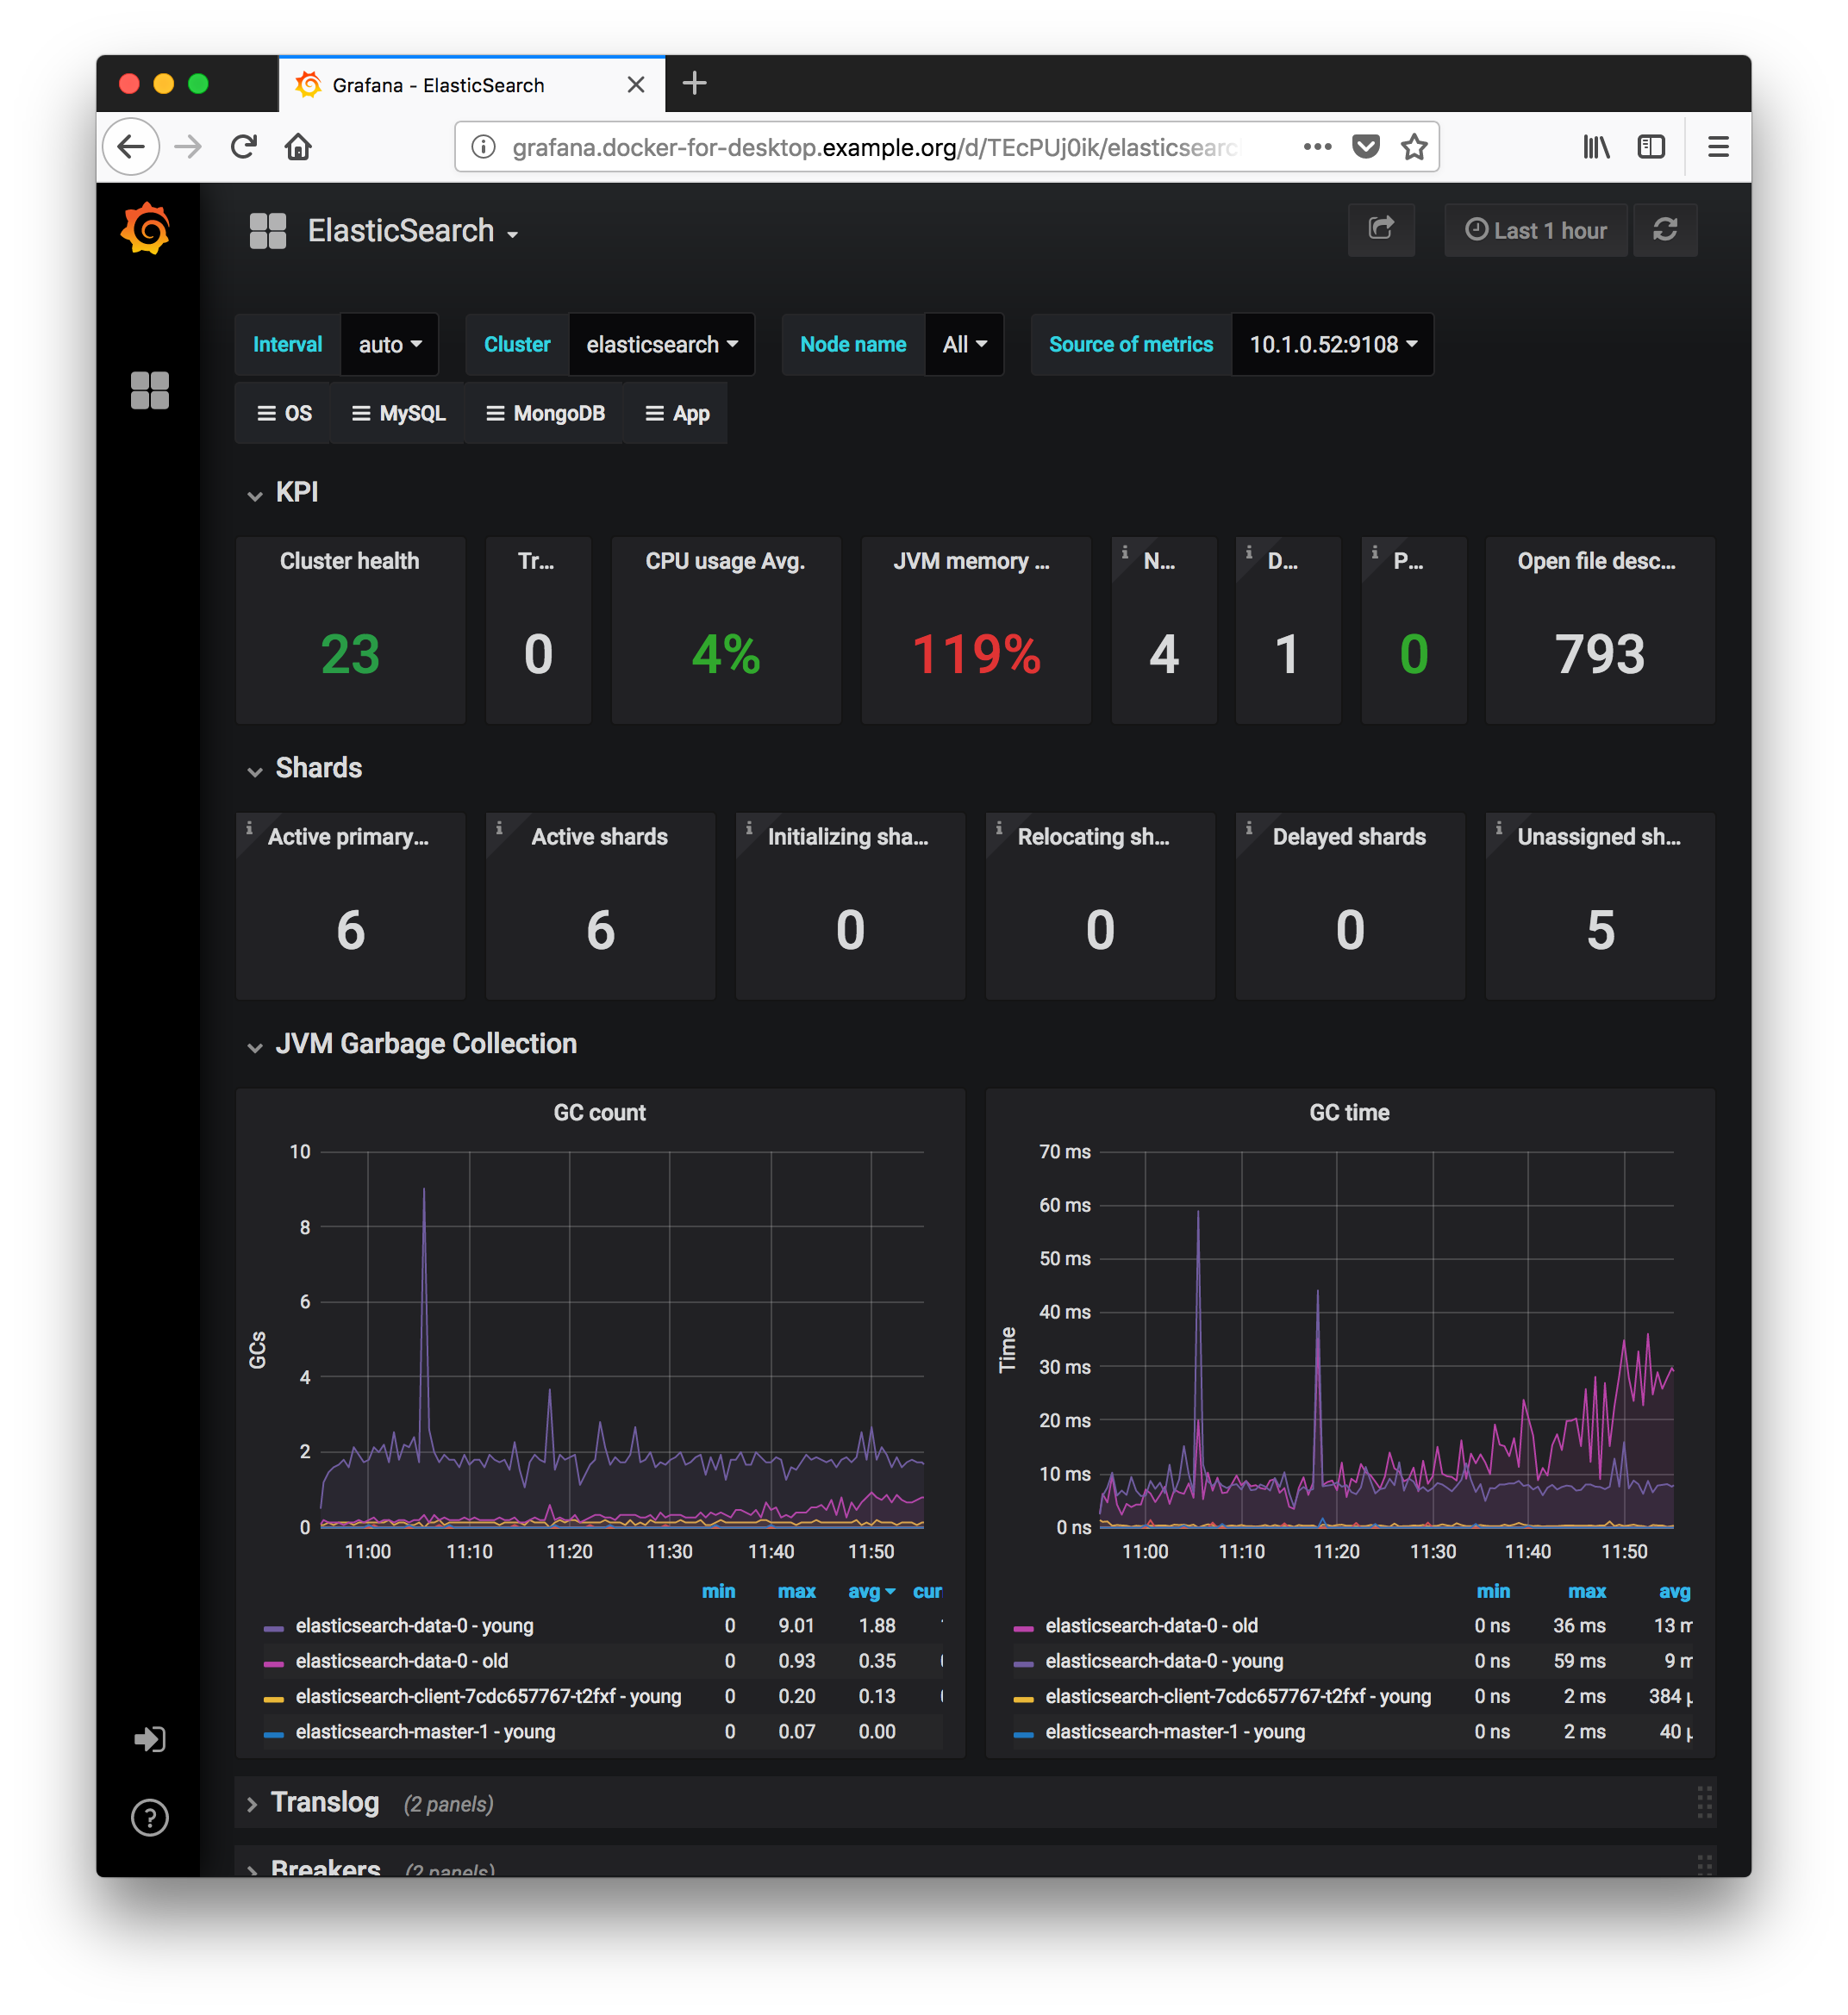
Explore Grafana
- Go to the Grafana admin panel:
- View the “Elasticsearch” Dashboard:
- Select
Home->ElasticSearch
- Select
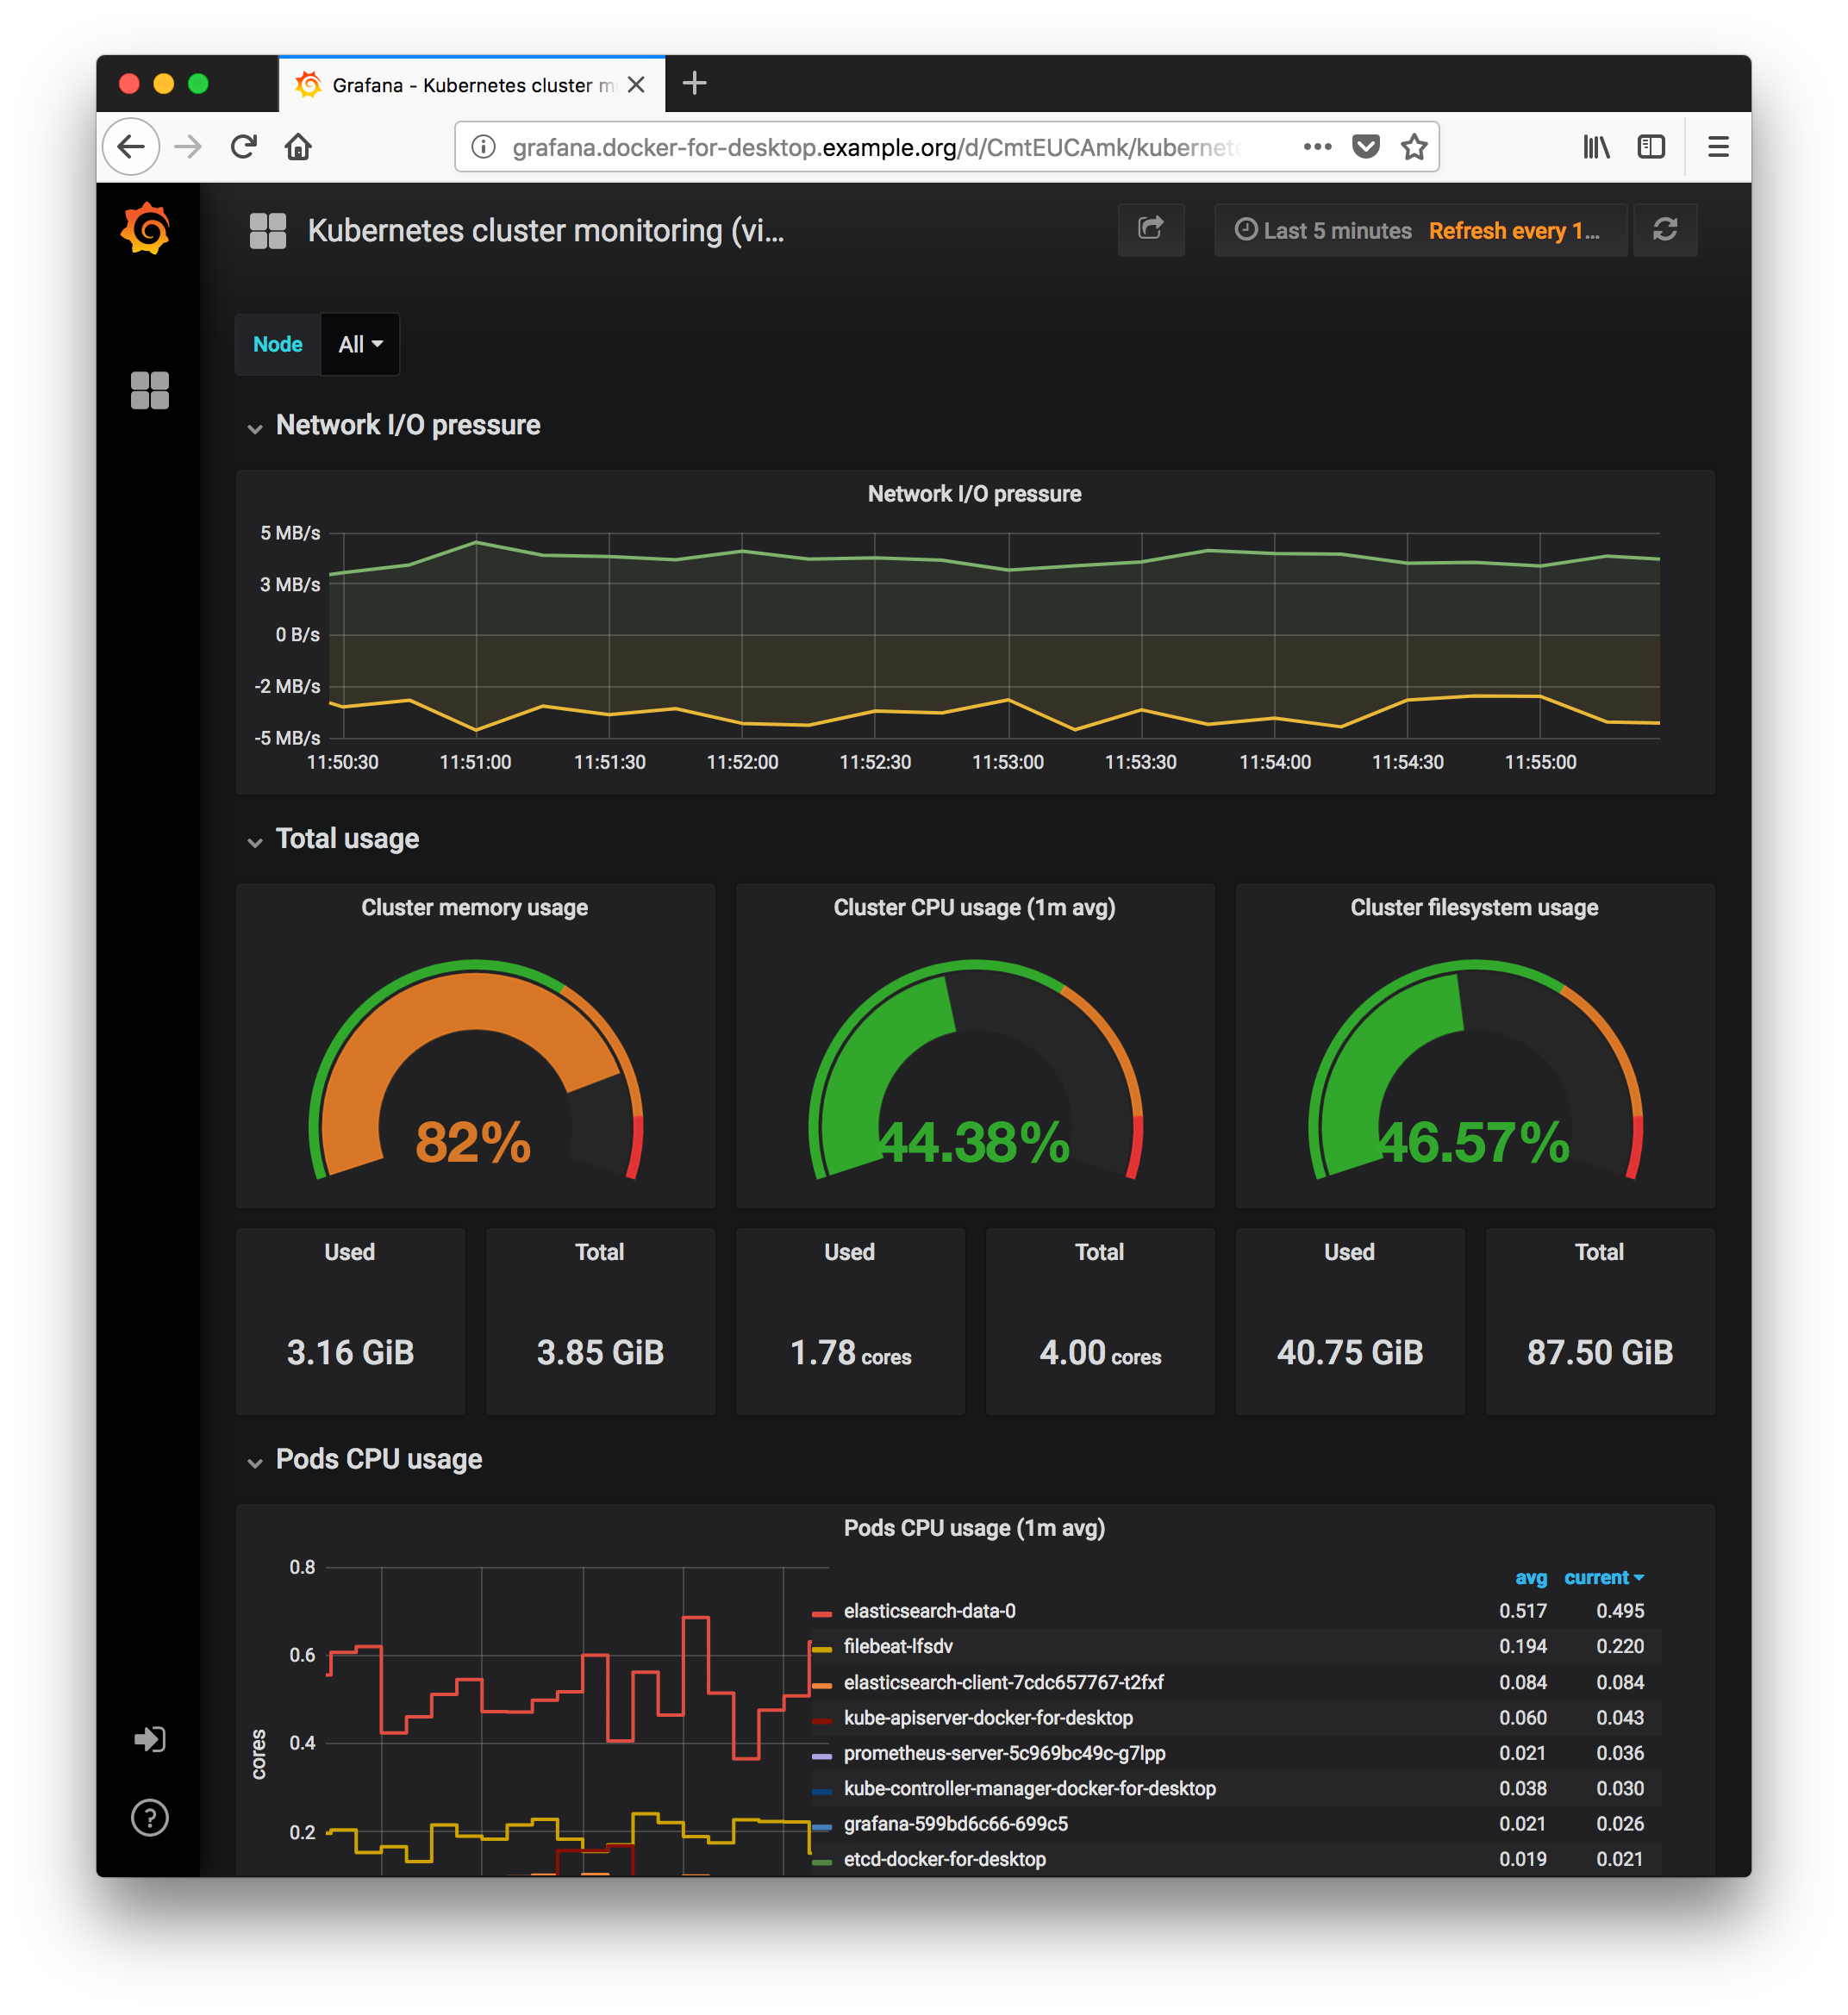
- View the “Kubernetes Cluster Monitoring” Dashboard:
- Select
Home->Kubernetes Cluster Monitoring
- Select
Explore Prometheus
- Go to the Prometheus admin panel:
- Create a graph of pod memory usage
- Click
Graph - Enter Expression:
- Click
sum (container_memory_working_set_bytes{image!="",name=~"^k8s_.*"}) by (pod_name)

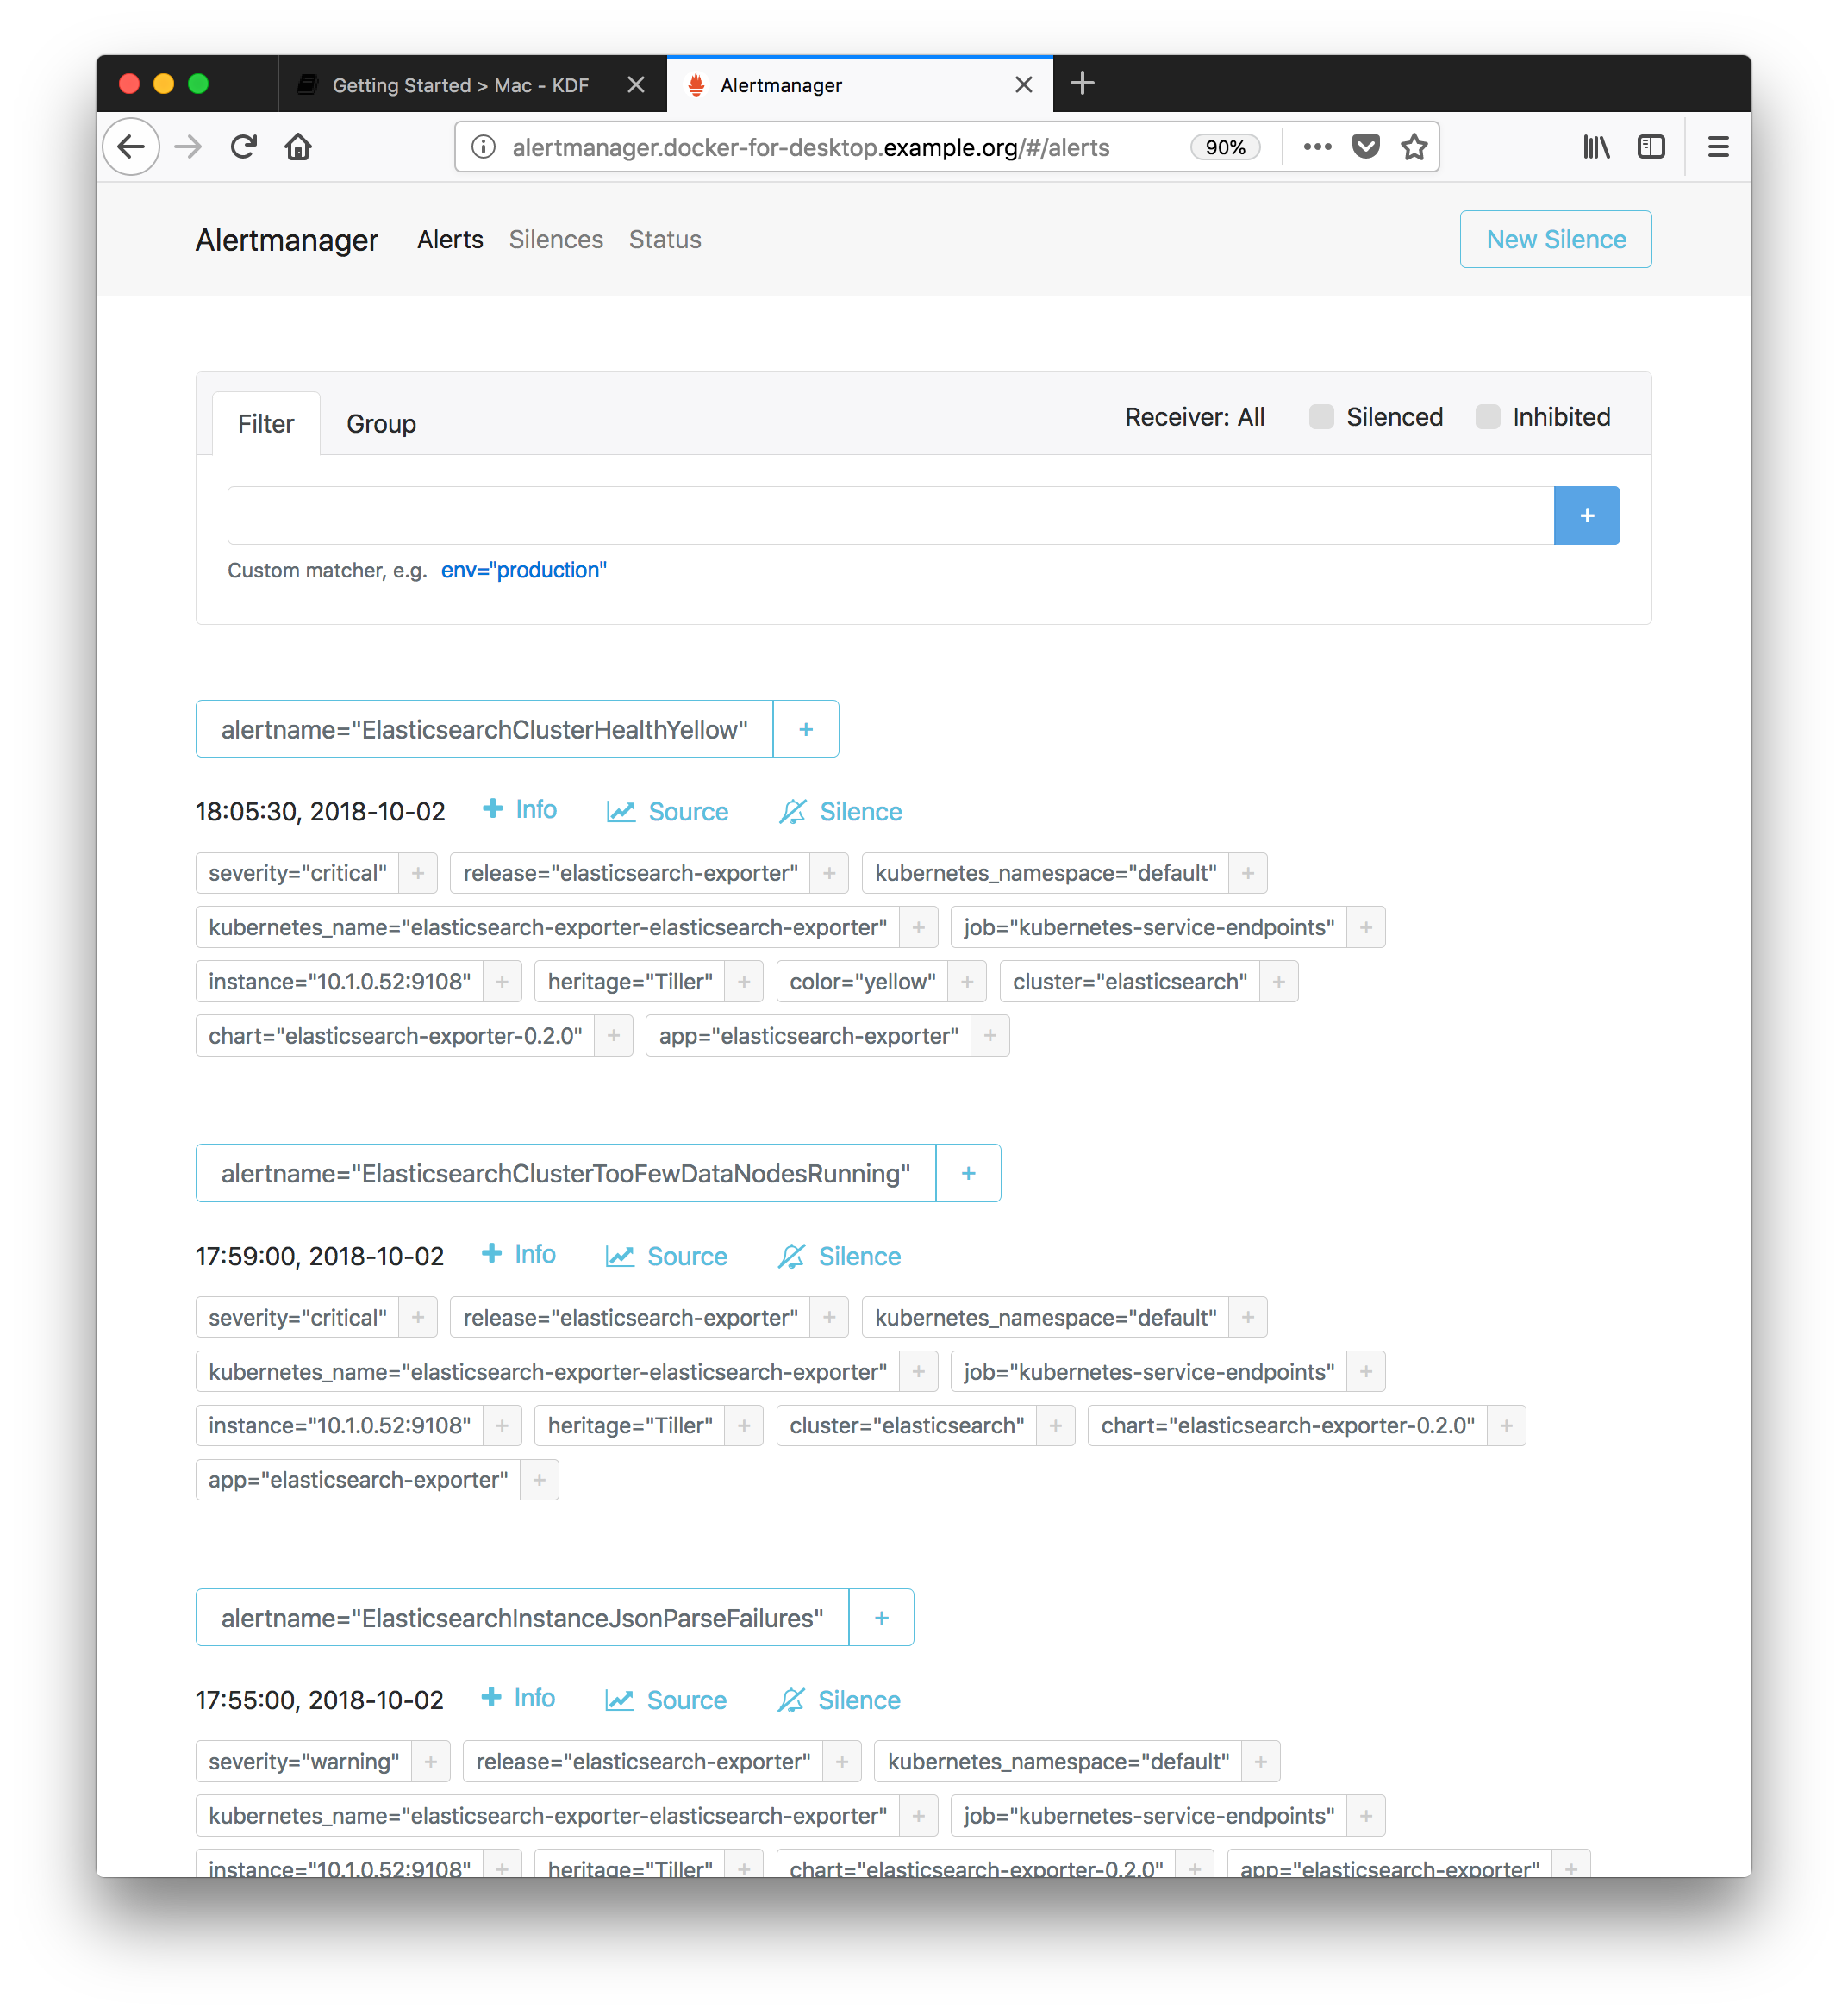
Explore Prometheus Alertmanager
- Go to the Prometheus Alertmanager admin panel:
- From the default landing page you may view all currently firing alerts
Post-Install
(optional)
Add your public SSH key to source control systems.
This is optional if you are using ssh-agent, which the KDK automatically forwards. Otherwise, you may directly configure the pre-generated ssh key which is used to connect to the KDK, within each source control provider.
Add content of ssh public key ~/.kdk/ssh/id_rsa.pub
- To your Github Account Keys
- To your Bitbucket Server https://<BITBUCKET-SERVER>/bitbucket/plugins/servlet/ssh/account/keys
Customing your .bash_profile
If you have installed Keybase, you may customize your bash profile by creating the file
/keybase/private/<user-keybase-id>/.bash_profile_private. The default KDK
.bash_profile will automatically source
the .bash_profile_private file from keybase, if it exists.
Customizing your dotfiles
If you have your own yadm dotfiles repository, you may kdk init with the option:
--dotfiles-repo string KDK Dotfiles Repo (default "https://github.com/cisco-sso/yadm-dotfiles.git")
The easiest way to create a compatible dotfiles repository is to fork the repository yadm-dotfiles.
Uninstall & Cleanup
This section documents a graceful deletion of resources. Quicker shortcuts do exist.
Delete all Kubernetes Resources
This will delete all running pods and persistent volume state
# From within the KDK: `kdk ssh`
cd framework-deploy/clusters/docker-for-desktop.example.org
## direnv: error .envrc is blocked. Run `direnv allow` to approve its content.
direnv allow
## ...

helm delete --purge $(helm ls| cut -d ' ' -f 1| grep -v NAME)
## release "chaoskube" deleted
## release "elasticsearch" deleted
## release "elasticsearch-exporter" deleted
## release "filebeat" deleted
## release "grafana" deleted
## release "kibana" deleted
## release "nginx-ingress-external" deleted
## release "prometheus" deleted
## // A shortcut command `mh destroy` is equivalent to the above

kubectl delete pvc $(kubectl get pvc| cut -d ' ' -f 1| grep -v NAME)
## persistentvolumeclaim "data-elasticsearch-data-0" deleted
## persistentvolumeclaim "data-elasticsearch-master-0" deleted
## persistentvolumeclaim "data-elasticsearch-master-1" deleted
## persistentvolumeclaim "data-test-mariadb-mariadb-master-0" deleted
## persistentvolumeclaim "data-test-mariadb-mariadb-slave-0" deleted
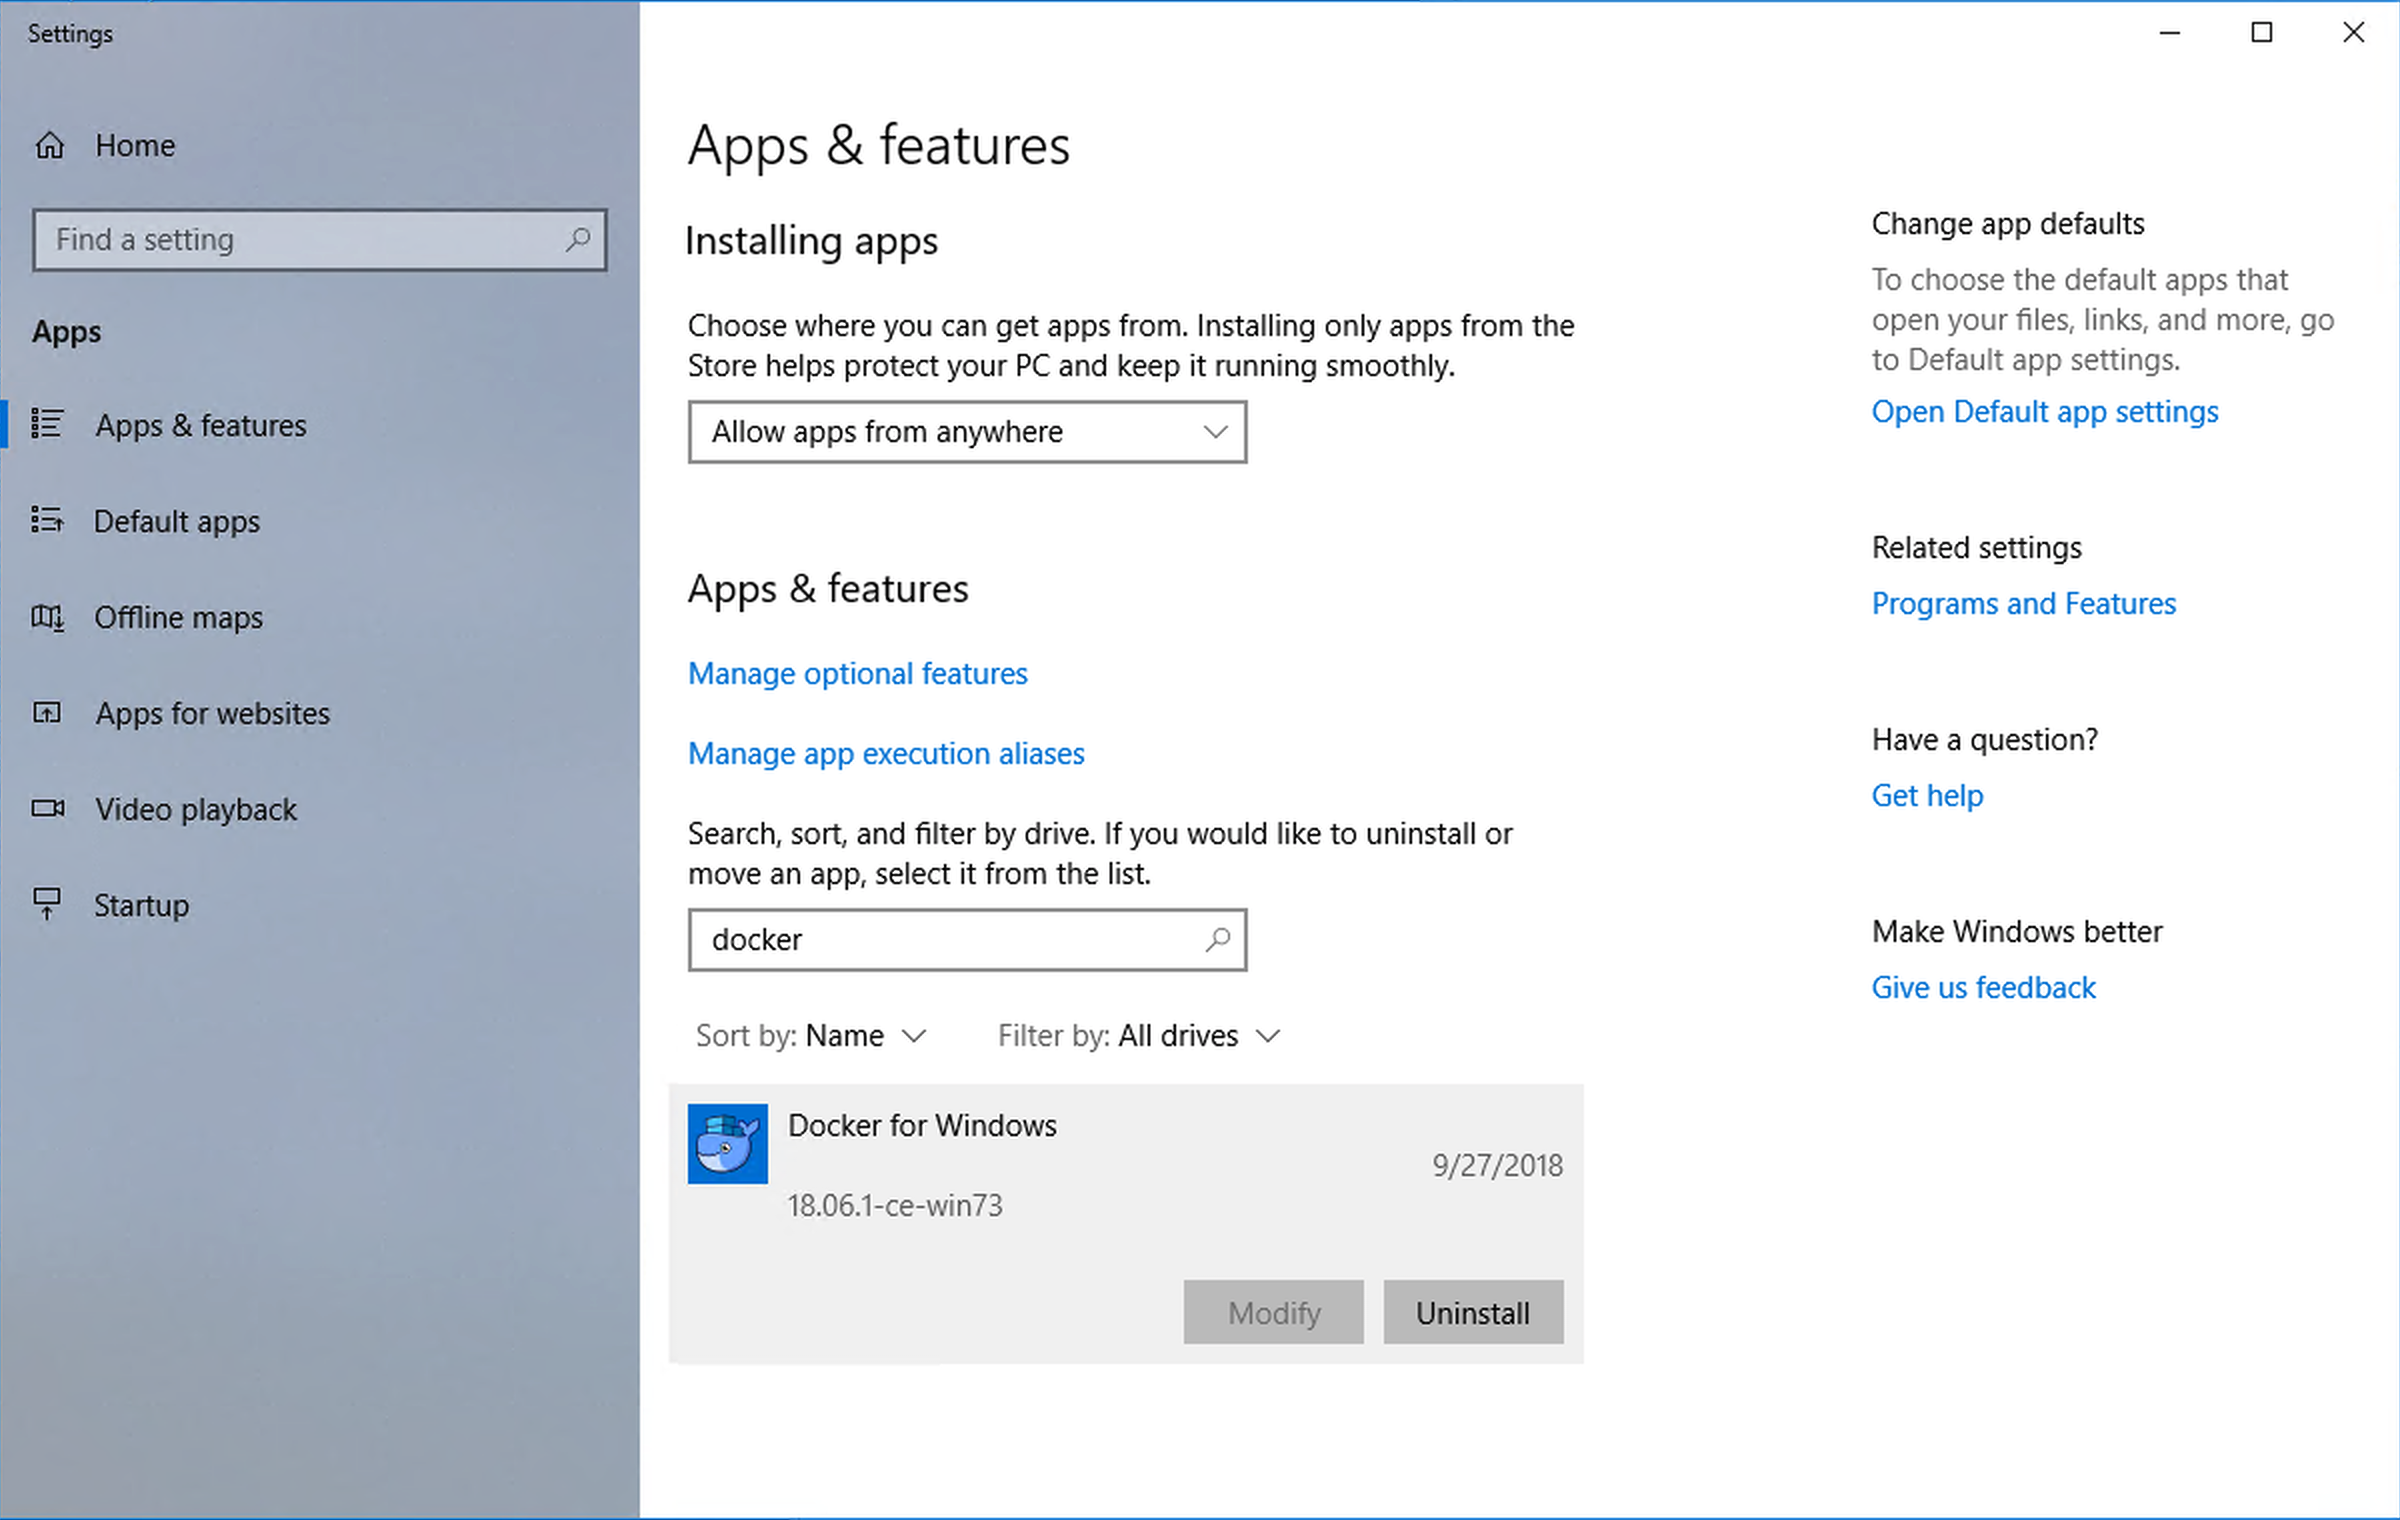
Uninstall Docker for Windows
Open “Add Or Remove Programs” through the Windows start menu search:
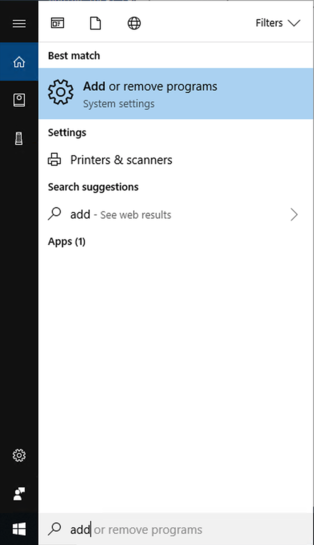
In the “Apps & Features” Search box:
- Enter:
docker - Click
Uninstall
- Enter:
Delete leftover Docker and Kubernetes state
# Windows Powershell on Host machine
del -r ~/.docker ~/.kube